About CCOM
Conducts seafloor mapping and ocean exploration missions with the help of marine robotic vessels. Funded by the National Oceanic and Atmospheric Administration (NOAA)’s Offices of Ocean Exploration and Coast Survey.
- Founded: 2000 at the University of New Hampshire
- Size: ~120 scientists, research staff, and graduate students
Impact
50% reduction
Developer tools required
60% increase
Users that can inspect logs
Over a week to several hours
Time to locate and analyze relevant mission data
At the University of New Hampshire’s Center for Coastal and Ocean Mapping (CCOM), over a hundred scientists, researchers, and graduate students collaborate on a variety of ocean mapping research projects and exploration missions.
To help conduct these missions at sea, CCOM has a marine robotics department with the goal of making robotic vessels practical, safe, and efficient for NOAA and the nation’s ocean mapping and exploration missions. In addition to developing their own systems, CCOM partners with robotics manufacturers to develop autonomous surface vehicles (ASVs). Unfortunately, many systems don’t provide robust robotics observability tools to visualize their vessels’ data. This makes it arduous and time-consuming for CCOM researchers to find relevant data for inspection, debug issues on-the-fly, and iterate on their autonomy software for the next mission.
By adopting Foxglove, CCOM’s multidisciplinary robotics team has been able to get insight into their marine vessels’ data faster than ever – whether that’s in the lab or out on mission at sea. This has helped the entire team codify newly streamlined processes for inspecting, analyzing, and exploring their mission logs.
Challenges
Manual data processing and exploration across tools
CCOM’s marine robotics team currently operates two large robotic vessels – BEN (Bathymetric Explorer and Navigator) is a C-Worker 4 built by ASV Global of L3/Harris, while the DriX 8 is another ASV built by Exail. Both have navigation systems, perception sensors, and sonar packages on board. These vessels are equipped with “backseat drivers” – computers running ROS and Project11, a ROS-based marine robotics software framework developed at the Center that allows the team to integrate with the vessel in ways not originally envisioned by the manufacturers. The C-Worker 4 logs data to a proprietary format, while the DriX has a ROS-based middleware and logs ROS BAG files.
Though these hardware companies provide robust physical platforms, CCOM needed equally robust forensic tools to understand how their vessels work, troubleshoot unexpected issues, and monitor real-time data feeds to safely teleoperate them. To even look at their data, much less harness its insights to improve their algorithms, CCOM researchers must go through an arduous conversion and parsing process.
Because BEN’s factory-delivered middleware isn’t ROS, the team had to shim it into their environment. Exporting logs was painfully clunky – BEN uses a proprietary binary log format that can be exported as CSV files, often multiplying the volume of data by orders of magnitude. Researchers had to parse these CSV files to make custom plots using Python or MATLAB, or convert it yet again into MATLAB’s MAT format or HDF5 files. Even after automating these conversion steps, the team struggled to sync BEN’s multimodal data across timestamps and visualize it all in one place or tool.
The DriX does come with ROS middleware, simplifying the process somewhat – it writes ROS 1 bag files that could be easily parsed and read by native tools like RViz. The downside is that these tools often struggle to load large data files and make it difficult to share insights with teammates.
Opaque technical workflows
Due to the nature of the team’s developer tooling setup – or lack thereof – meaningful data analysis was often restricted to technical teammates.
While some team members have had experience writing software, a good portion of CCOM’s marine robotics team are technicians with little to no coding experience. These technicians could have deep expertise in topics like diesel engines, electrical power generation and distribution, or material corrosion, but lacked the skills to access and visualize vessel logs. As much as other technical teammates tried to enable access, there were a limited number of hours in the day to support them. Without a user-friendly developer tool to display the information for them, these teammates were unable to troubleshoot problems and analyze long-term trends. .
Difficulty finding interesting data
CCOM expeditions often span 4 to 5 days, with certain fields’ data rates as high as 100Hz – this results in tens of gigabytes of recorded data for every mission. The DriX alone collects between 5 to 7GB of data as ROS bag files for upload to Foxglove. In fact, the team’s marine robotics vessels collect so much data that researchers spent weeks parsing it and locating specific ranges of it to explore further. Knowing what time range and topics to target when finding data worth analyzing was a huge challenge. Manipulating this data via scripts often excluded many team members from getting involved. Even technical team members could take days to sift through this data and find ranges of interest, but non-technical team members could take multiple weeks for this same task.
During missions, researchers keep a manual log – whenever something out of the ordinary happens, they take a note of the time and add details. These notes work as a reference when team members go back and scrutinize the logs to find parts of data that are of interest. The team also wrote code to run at the end of every day to parse data and automatically construct a few plots for things that had historically been useful to look at. After those plots were available, you could reference them to dive deeper into specific events. While these scripts did get to the heart of what people wanted to look at frequently, it was still a challenge going through so much data.
Deploying Foxglove to accelerate development
CCOM has been able to tackle their dense multimodal data with an intelligent strategy and one software solution: the Foxglove observability platform.
Synced data ready for inspection in one integrated environment
With Foxglove, CCOM can now sync their multimodal data across time for immediate analysis. Even though their manufacturing partners don’t provide these visualization and playback tools out-of-the-box, Foxglove provides a ready-to-go development environment that gets robotics observability working within minutes.
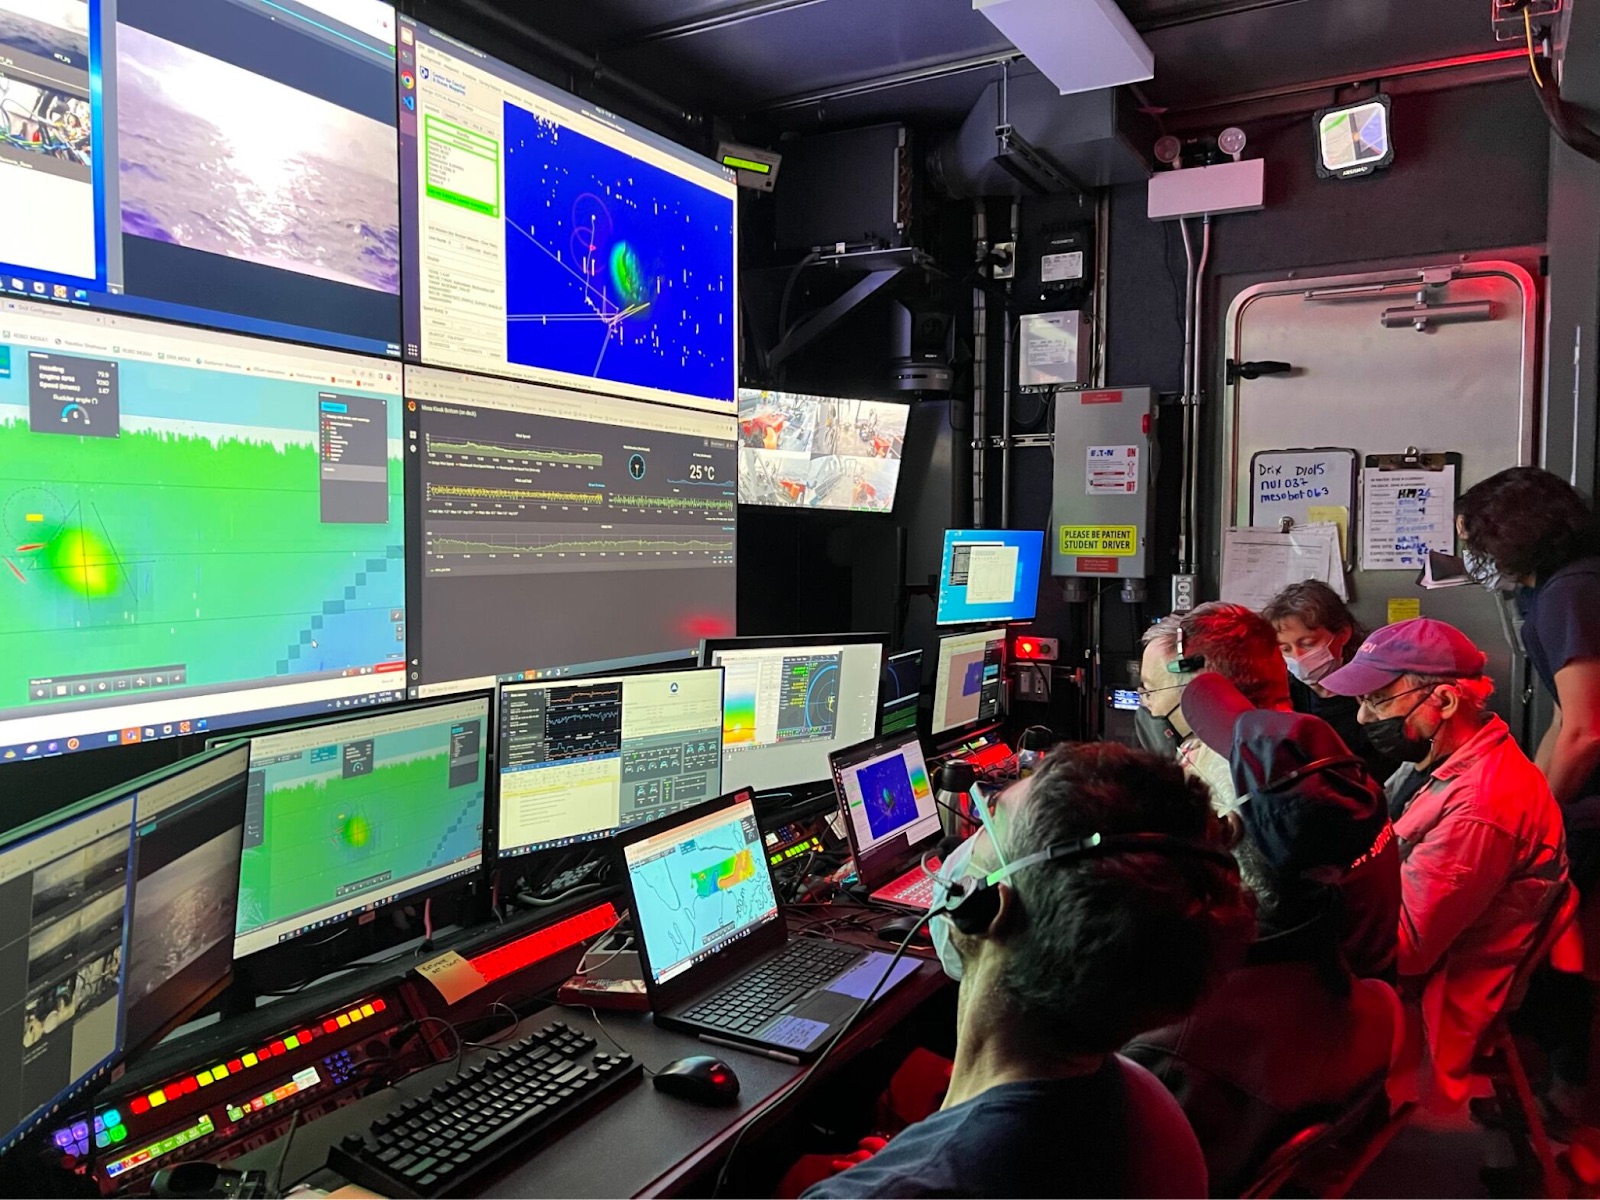
When launching their ASVs from ships at sea for missions, researchers use Foxglove to teleoperate the vessels from laptops onboard the host ship. They can also display real-time feeds of multimodal data – from camera images and GPS points to plotted kinematics and filtered logs – and monitor operational parameters critical to mission success – like the engine RPM, or the temperature of the cooling system and exhaust. All these visualizations work together to give researchers a well-rounded understanding of what’s going on.
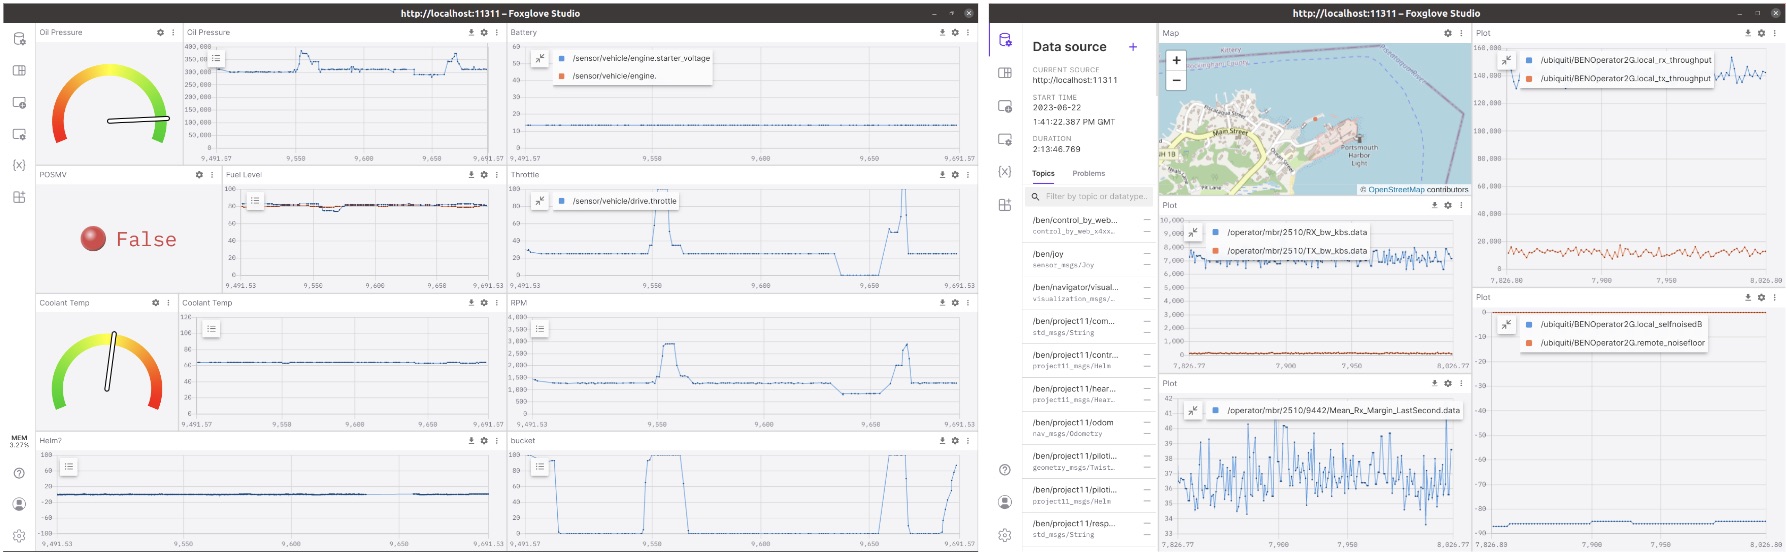 Foxglove layouts are used to monitor engine parameters (like RPM, coolant temperature, and fuel level) and vessel trajectory.
When inspecting data after missions, the CCOM team uses Foxglove’s data playback functionality to visualize the collected data and troubleshoot any issues that may have come up during the excursion. The data can be represented visually in different ways for more comprehensive and faster analysis, synchronized across space and time. For example, they can now easily view their vessel’s position on a map, and then immediately tie that to some plotted time series data, the current camera image, or the current 3D point cloud.
Foxglove has stood on the shoulders of giants in the ROS community. For those of us working on robots with ROS middleware, it's hard to beat the capability of Foxglove.
- Val Schmidt, Lead at the Marine Robotics DepartmentSupporting non-technical teammates
Every member of the marine robotics team – technical or otherwise – can now use Foxglove to access mission logs. Everyone is now empowered to explore all collected robotics data, because they're able to use a user-friendly interface like Foxglove to quickly inspect it from different angles.
This has been made even easier with preset layouts. Team members can now configure custom layouts specific to certain development workflows, to help users narrow down what topics to start looking at for a given objective.
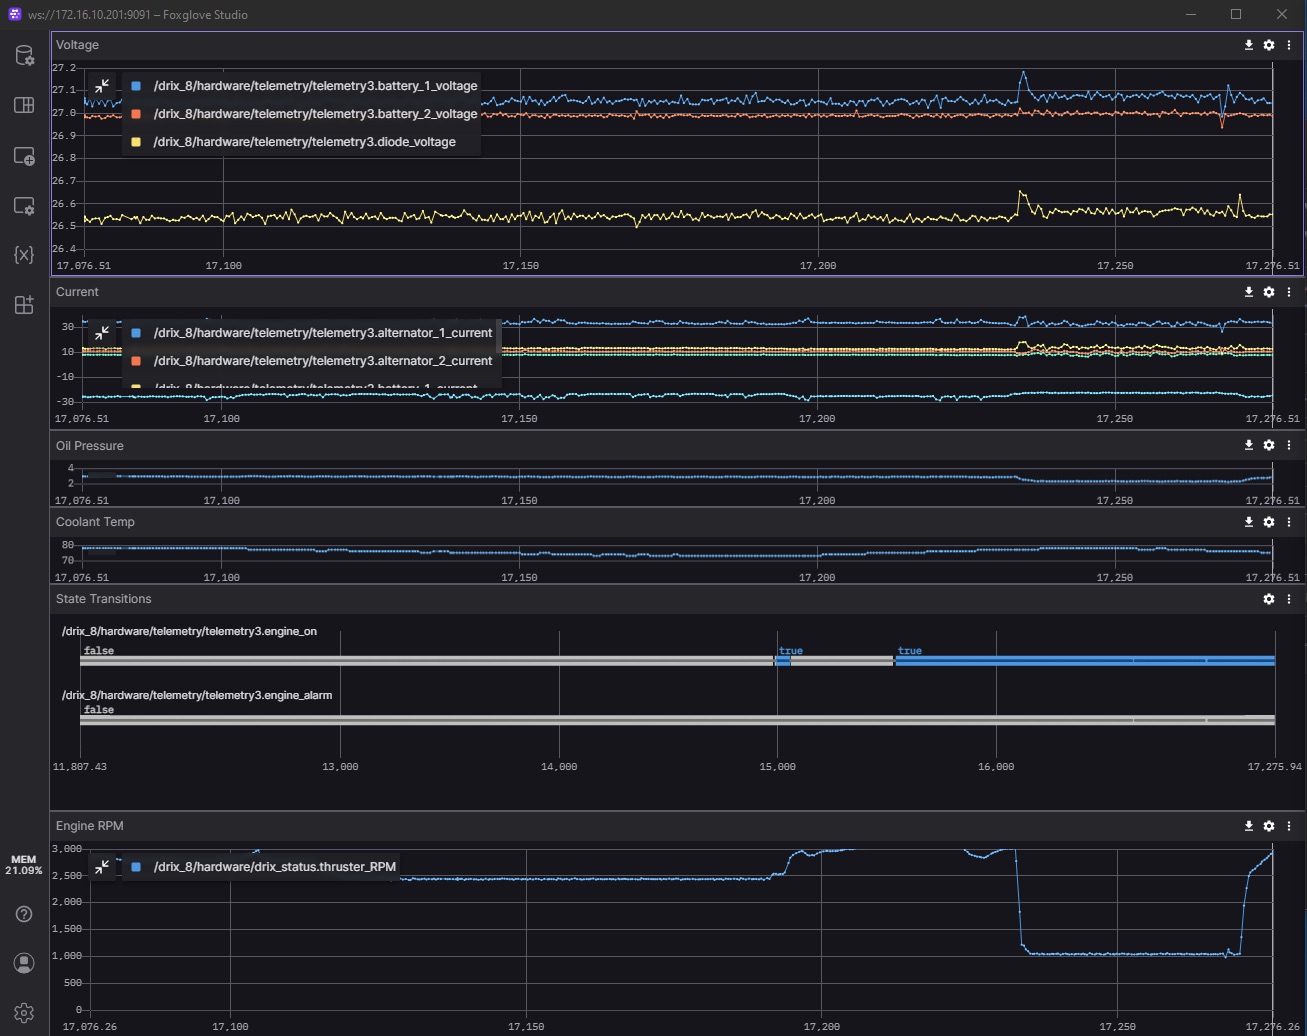
For example, the CCOM team created one layout primarily for monitoring their vessels’ engine data – i.e. engine RPM, oil pressure, and coolant or engine compartment temperature. Another custom layout monitors the vessels’ telemetry systems – the signal to noise, the bandwidth usage over each telemetry link in each direction. Still another layout monitors the health of the navigation system – namely, the IMU / GPS unit that helps take accurate measurements of the ocean’s depth while the boat bobs around. Since its health is critical to the success of seafloor mapping missions – without it, the mapped seafloor could look like it’s “moving” – the team created this particular layout to focus on calibrating this important piece of equipment.
Less time and effort to locate relevant data
Before Foxglove, scrutinizing hours of log files and locating important ranges in those gigabytes of data often took several weeks. With Foxglove’s intuitive web interface for organizing and searching for data, this same work can now take as little as a few hours.
Now that all data is uploaded to the cloud, team members can immediately access it upon import. In addition to preset layouts, they can also share custom user scripts, annotate specific parts of the data with metadata, and much more. Foxglove’s web interface makes it easy to search and filter data by a variety of categories – like recording device, time range, and even metadata values.
On missions, when there are urgent parts of the data that researchers need their manufacturing partners or another teammate onshore to scrutinize, they can use the limited connectivity they have to push just that subset of the data. From there, someone who isn’t onboard the ship during the mission can still scrutinize specific snippets of data and give helpful feedback during the course of the excursion.
As a product of all this, the time to diagnose issues or keep track of live metrics has dropped significantly.
Outcome
Thanks to Foxglove, CCOM has been able to streamline their workflows for finding and exploring their data. Instead of having to manually convert data into different formats and opening different tools to explore it, researchers can now just drag-and-drop their data files into Foxglove to start scrutinizing their logs. Instead of spending weeks slogging through gigabytes of data to find what they need, they can now use the wealth of visualization tooling Foxglove provides to quickly locate where they should start inspecting their data.
With Foxglove, CCOM has empowered more team members to investigate their data, increase their rate of development, and iterate more quickly and confidently on their autonomous surface vehicles.